Each bundle shows how your process is running.
The calculation starts with the bar count
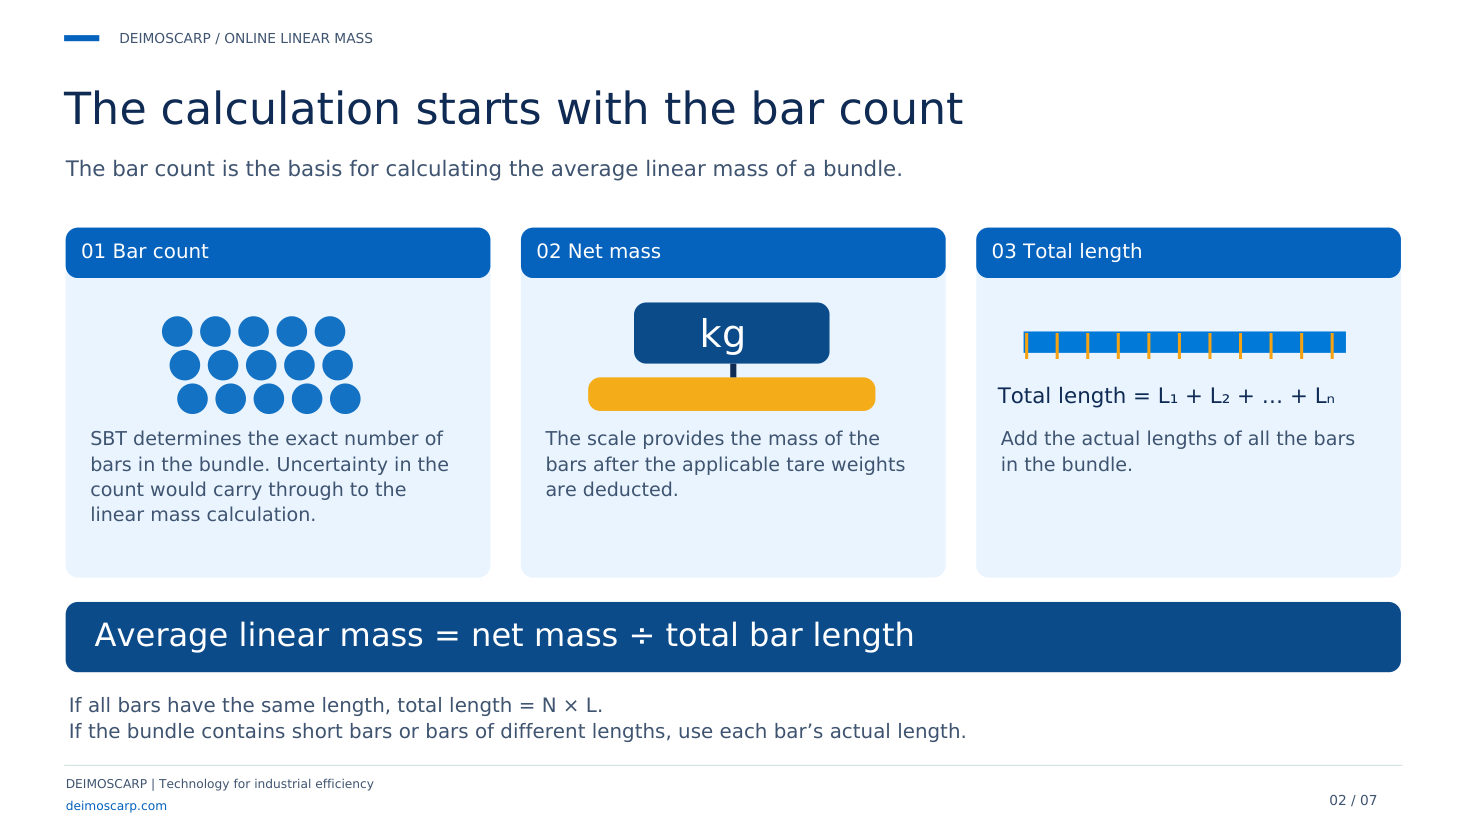
The bar count is the basis for calculating the average linear mass of a bundle: average linear mass = net mass ÷ total bar length.
SBT determines the exact number of bars in the bundle; uncertainty in the count would carry through to the linear mass calculation. The scale provides the mass of the bars after the applicable tare weights are deducted, and the actual lengths of all the bars in the bundle are added up.
If all bars have the same length, total length = N × L. If the bundle contains short bars or bars of different lengths, use each bar's actual length.
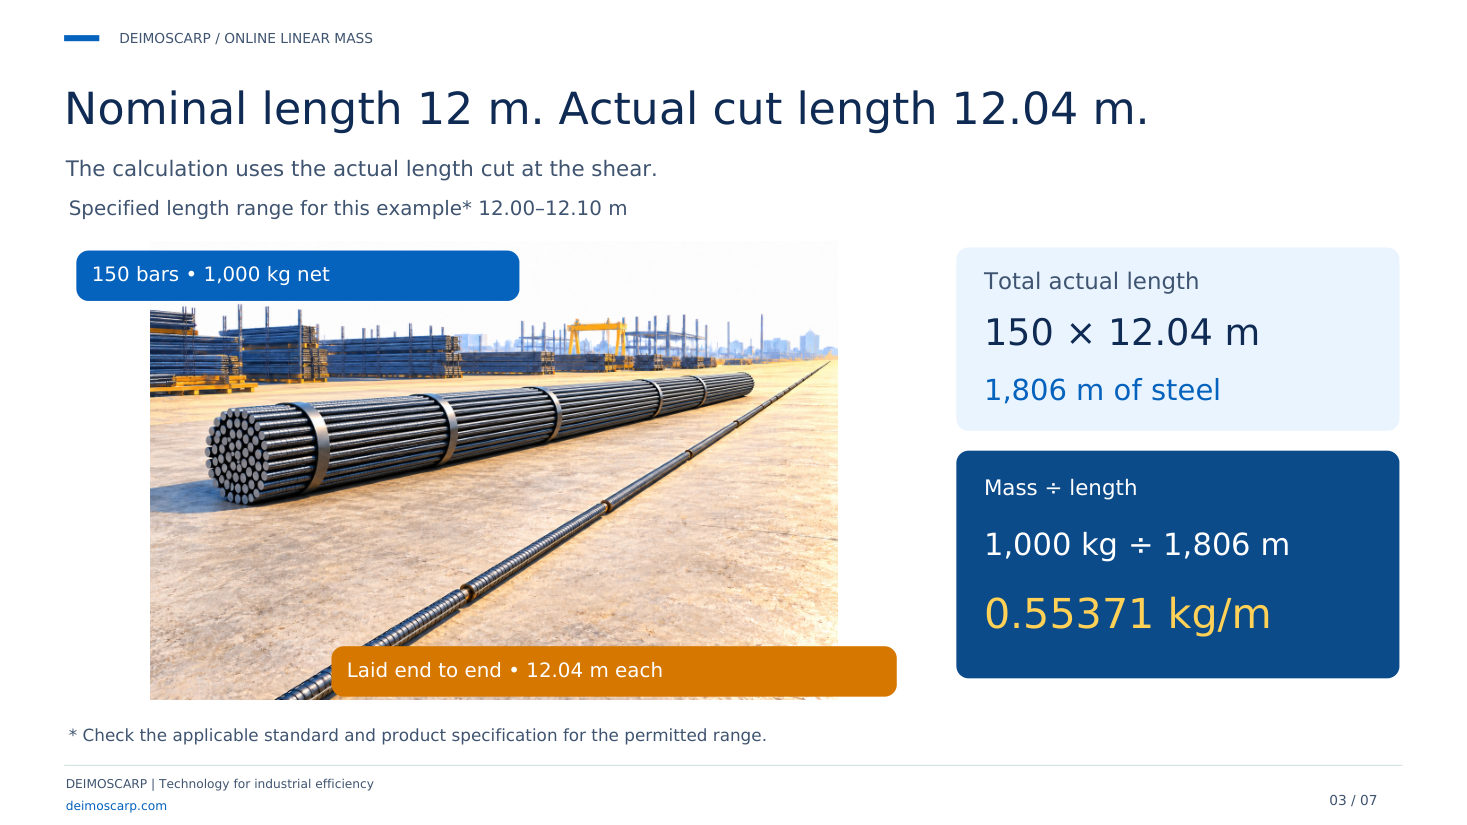
Example: 150 bars, 1,000 kg net
Nominal length 12 m, actual cut length 12.04 m: the calculation uses the actual length cut at the shear. Specified length range for this example: 12.00–12.10 m (check the applicable standard and product specification for the permitted range).
Total actual length: 150 × 12.04 m = 1,806 m of steel. Linear mass: 1,000 kg ÷ 1,806 m = 0.55371 kg/m.
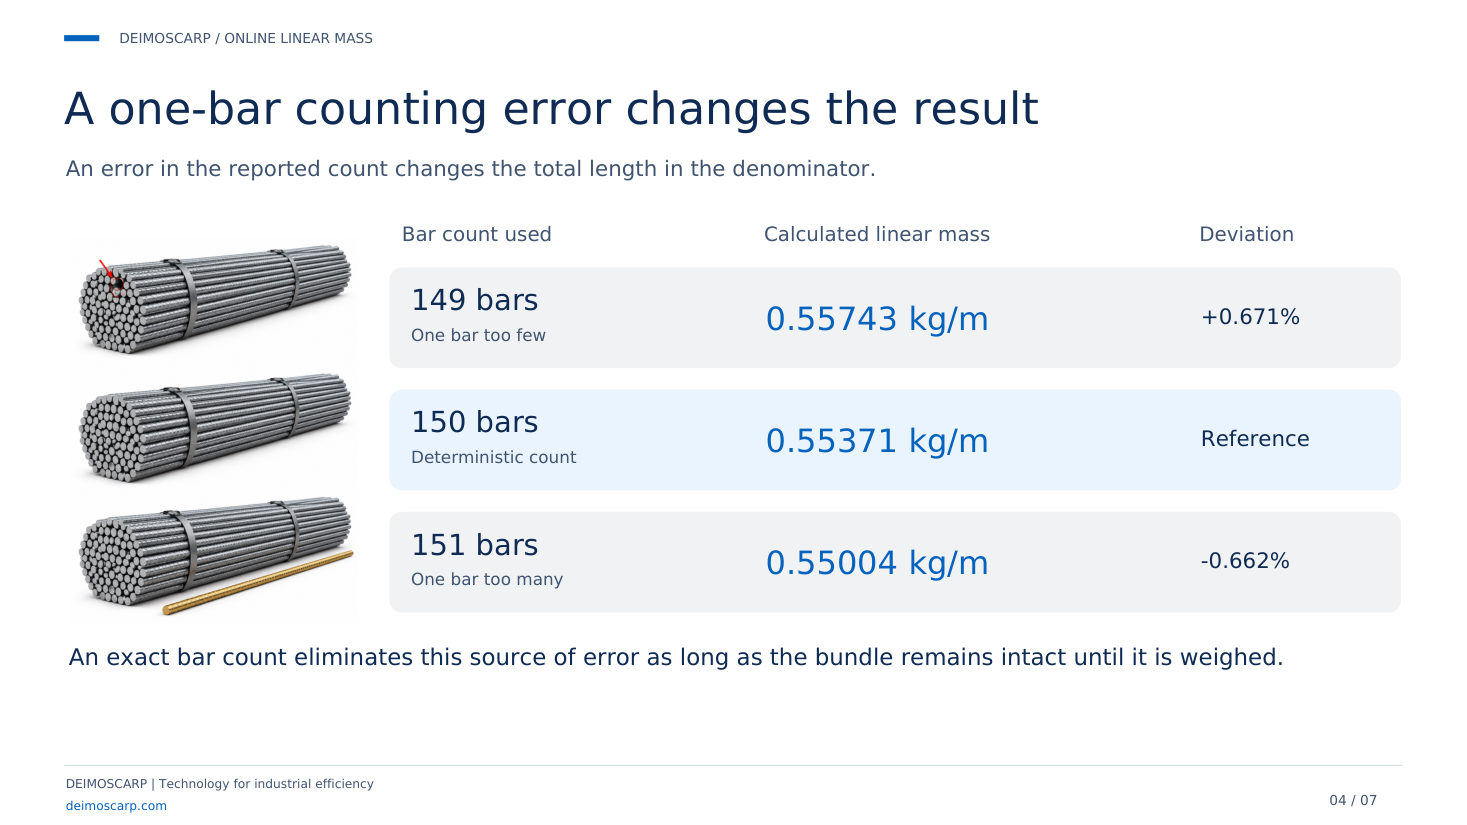
A one-bar counting error changes the result
An error in the reported count changes the total length in the denominator. With 149 bars (one too few), the calculated linear mass is 0.55743 kg/m (+0.671%); with 151 (one too many), 0.55004 kg/m (−0.662%).
An exact bar count eliminates this source of error as long as the bundle remains intact until it is weighed.
Process updates between samples
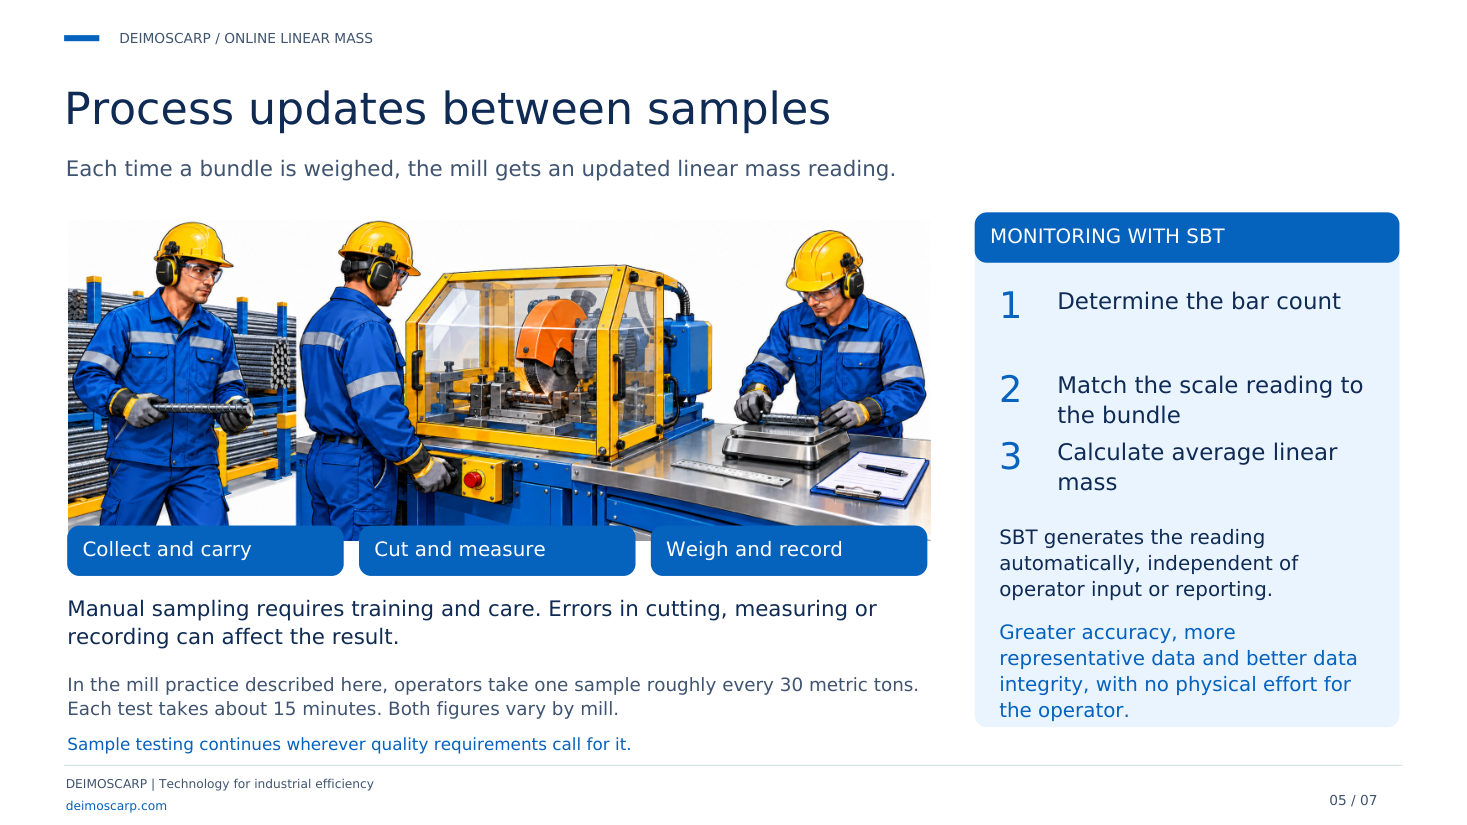
Manual sampling (collect and carry, cut and measure, weigh and record) requires training and care; errors in cutting, measuring or recording can affect the result. In the mill practice described, operators take one sample roughly every 30 metric tons and each test takes about 15 minutes. Both figures vary by mill. Sample testing continues wherever quality requirements call for it.
Monitoring with SBT: determine the bar count, match the scale reading to the bundle and calculate the average linear mass. SBT generates the reading automatically, independent of operator input or reporting, with greater accuracy, more representative data and better data integrity, and no physical effort for the operator.
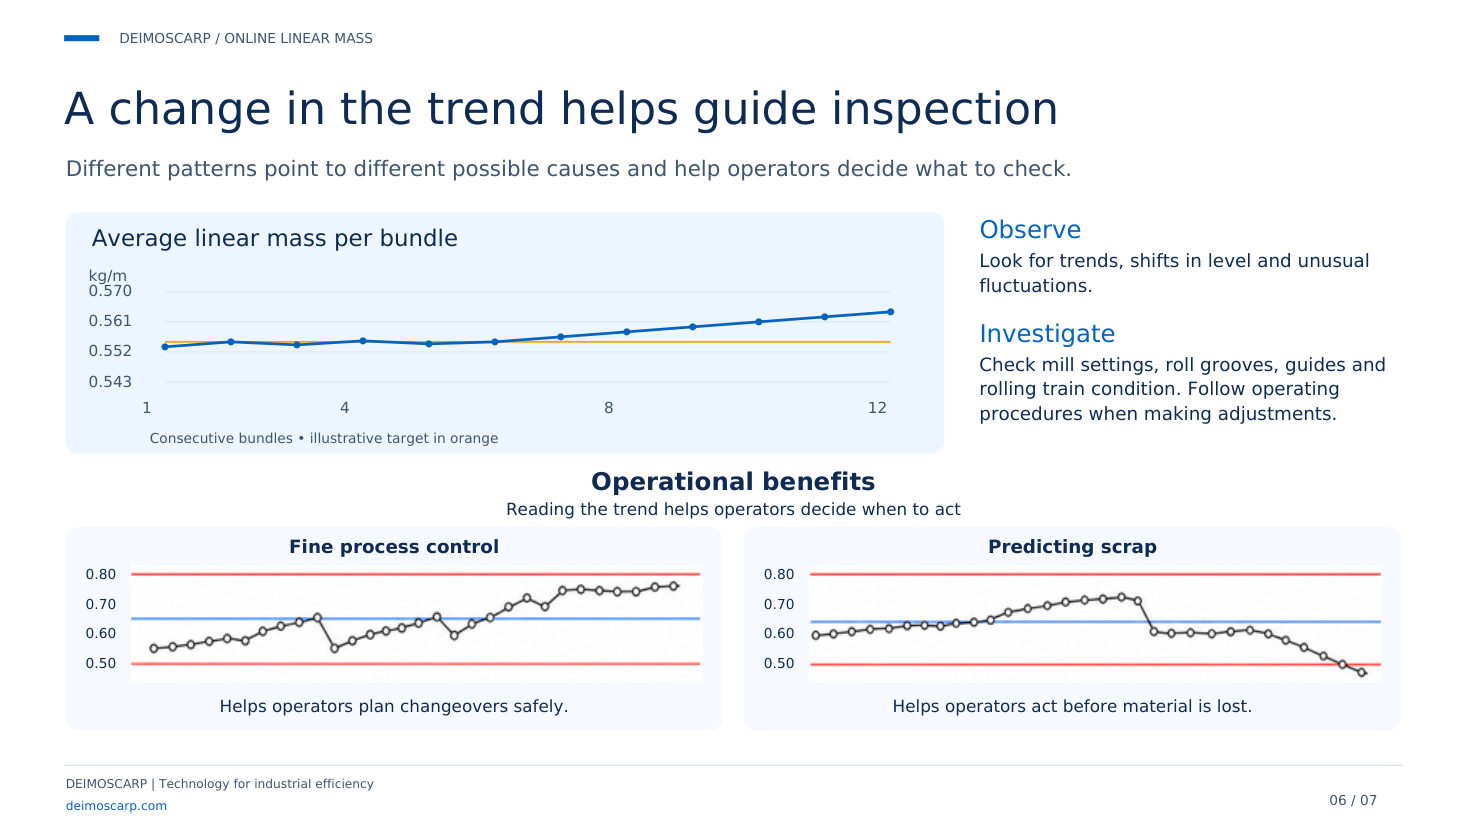
A change in the trend helps guide inspection
Different patterns point to different possible causes and help operators decide what to check. Observe: look for trends, shifts in level and unusual fluctuations. Investigate: check mill settings, roll grooves, guides and rolling train condition, following operating procedures when making adjustments.
Operational benefits: reading the trend helps operators decide when to act. Fine process control helps operators plan changeovers safely; predicting scrap helps operators act before material is lost.
From linear mass to process control
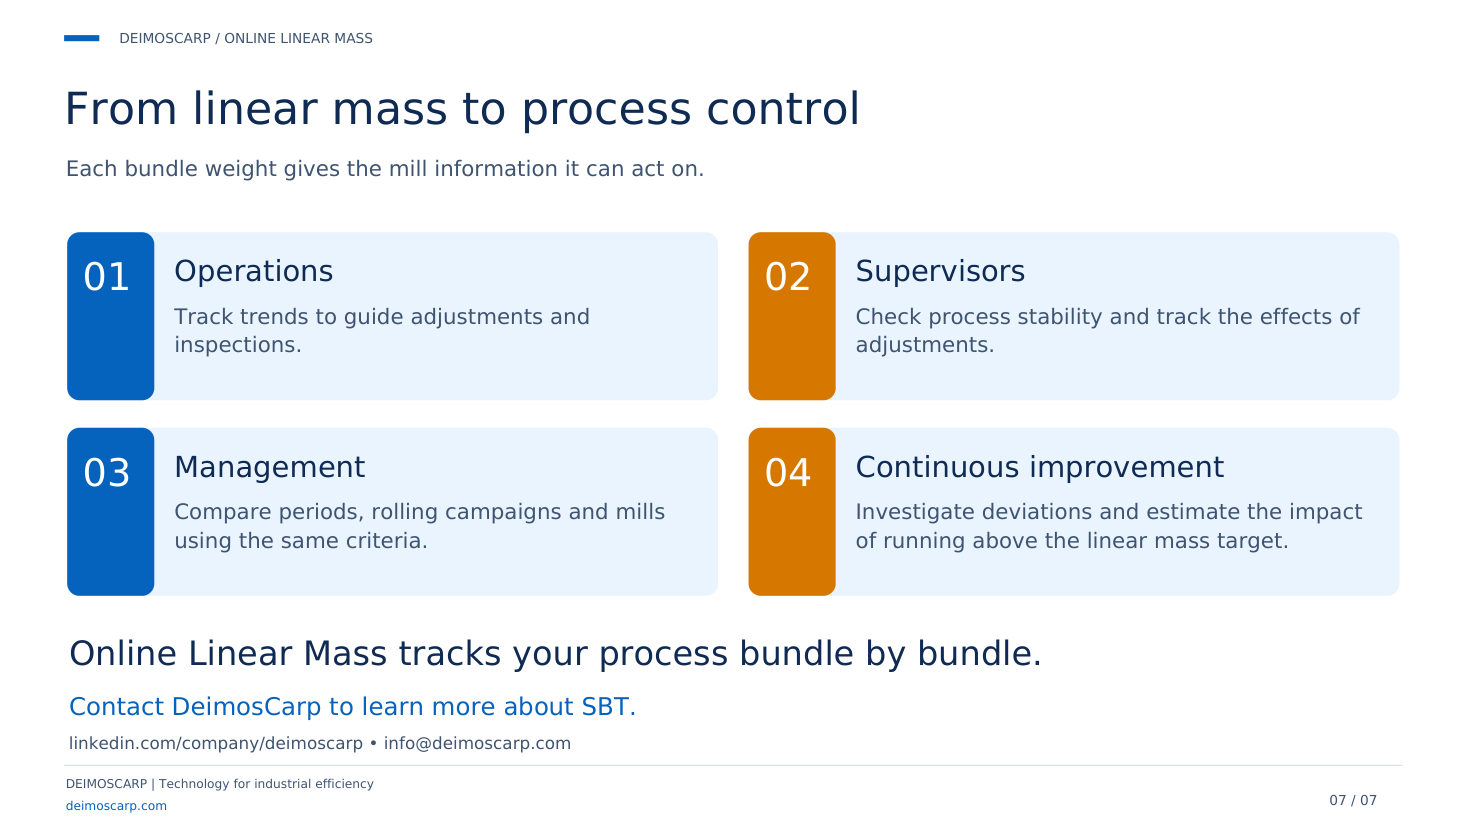
Operations: track trends to guide adjustments and inspections. Supervisors: check process stability and track the effects of adjustments. Management: compare periods, rolling campaigns and mills using the same criteria. Continuous improvement: investigate deviations and estimate the impact of running above the linear mass target.
Online Linear Mass tracks your process bundle by bundle.