Process insights to guide action during production and track the performance of each indicator: operations, area leadership, management and executives.
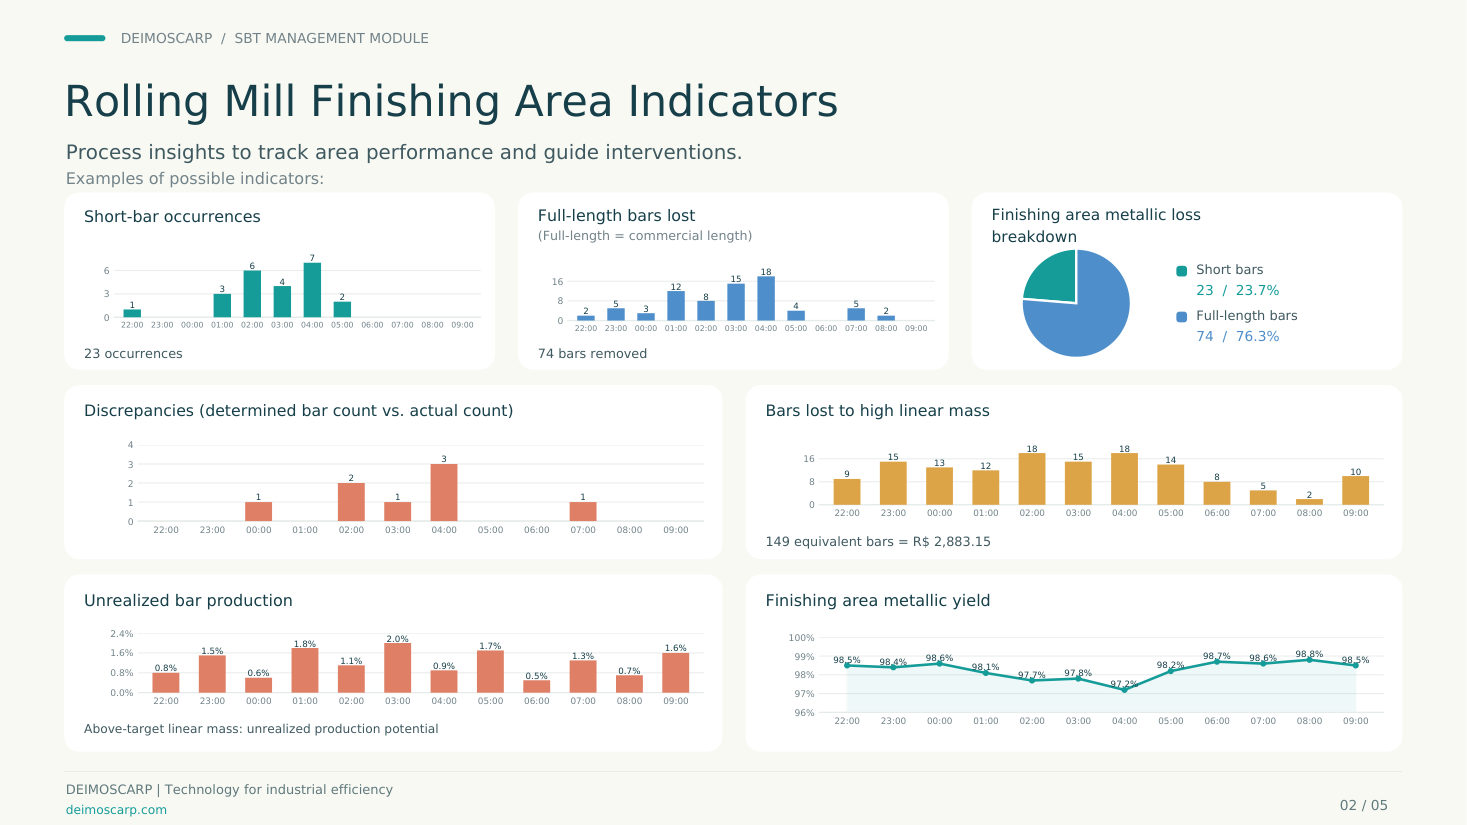
Rolling mill finishing area indicators
Process insights to track area performance and guide interventions. Examples of possible indicators: short-bar occurrences, full-length bars lost, finishing area metallic loss breakdown, discrepancies between determined and actual bar count, bars lost to high linear mass, unrealized bar production and finishing area metallic yield.
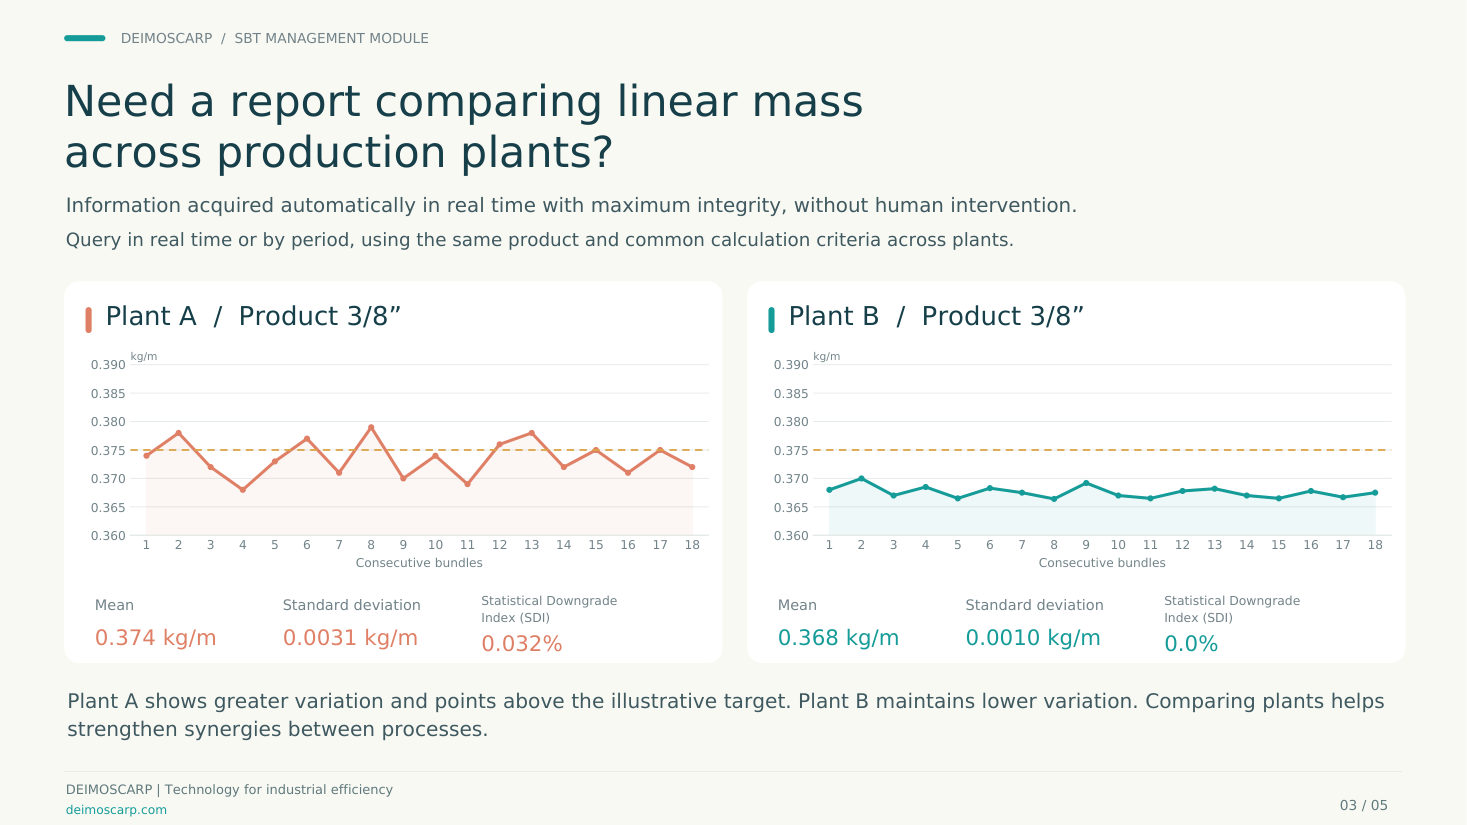
Linear mass comparison across plants
Information acquired automatically in real time with maximum integrity, without human intervention. Query in real time or by period, using the same product and common calculation criteria across plants.
Comparing plants helps strengthen synergies between processes.
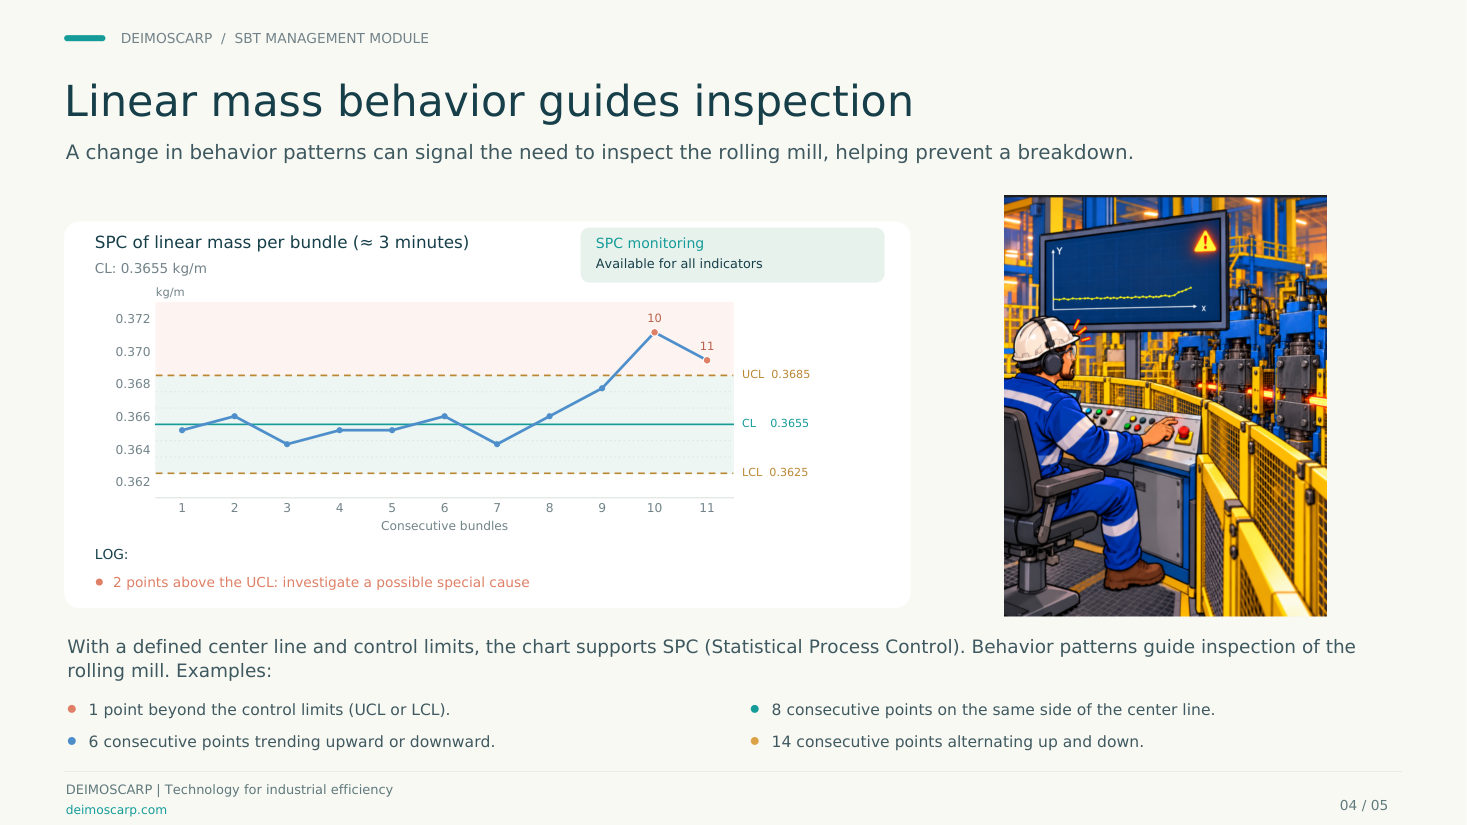
Linear mass behavior guides inspection
A change in behavior patterns can signal the need to inspect the rolling mill, helping prevent a breakdown. With a defined center line and control limits, the chart supports SPC (Statistical Process Control), available for all indicators.
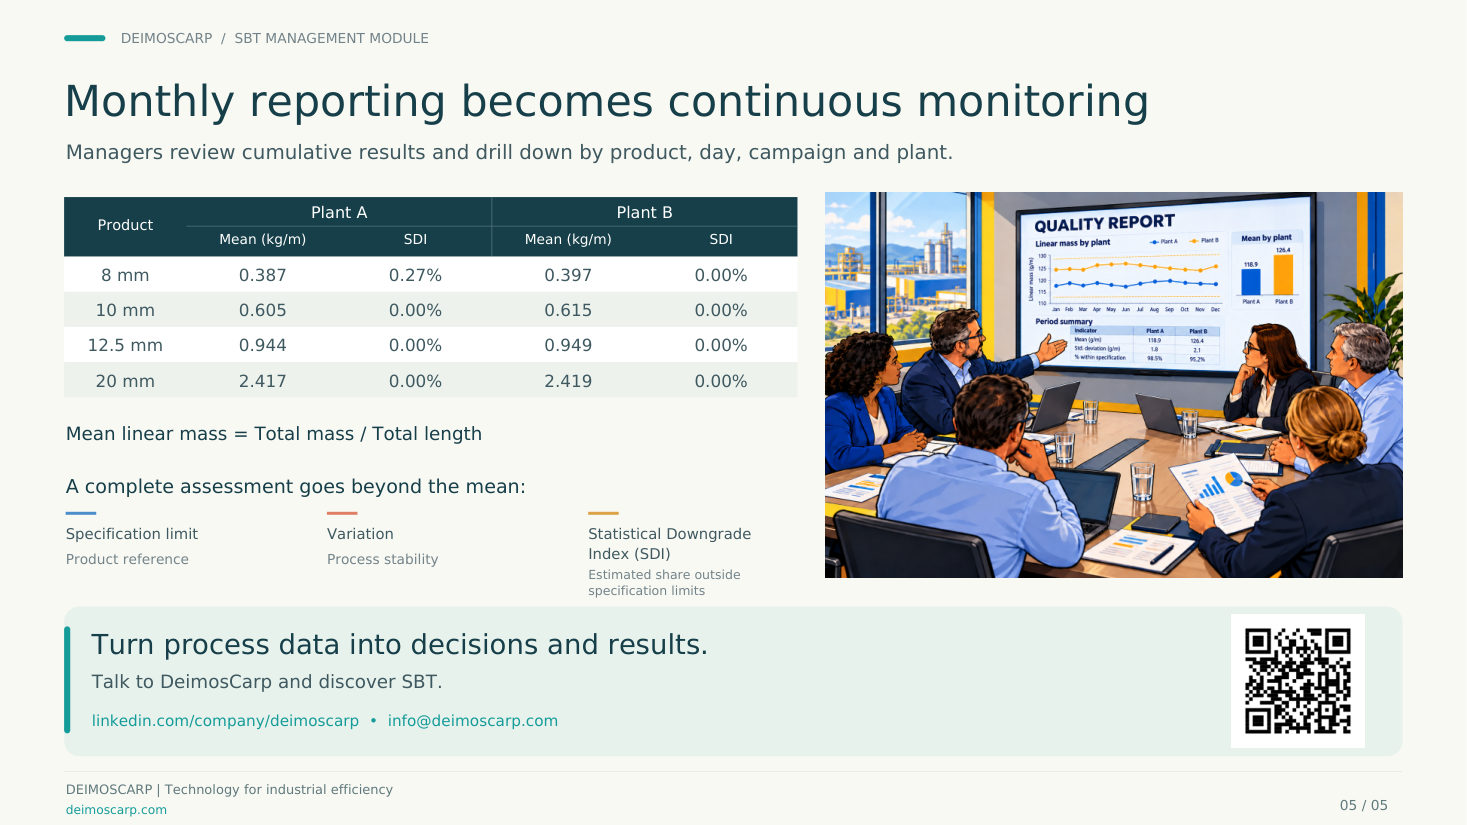
Monthly reporting becomes continuous monitoring
Managers review cumulative results and drill down by product, day, campaign and plant. A complete assessment goes beyond the mean: specification limit, variation and the Statistical Downgrade Index (SDI), the estimated share outside specification limits.